
Lead and Lag INDICATORS
 Edmonds College has embraced a lead and lag metric framework in measuring progress
toward goals and strategies. Adapted from the book, Creating a Data Informed Culture
at Community Colleges, we have been able to identify appropriate outcomes with milestone
metrics that influence them.
Edmonds College has embraced a lead and lag metric framework in measuring progress
toward goals and strategies. Adapted from the book, Creating a Data Informed Culture
at Community Colleges, we have been able to identify appropriate outcomes with milestone
metrics that influence them.
Lead and Lag Model
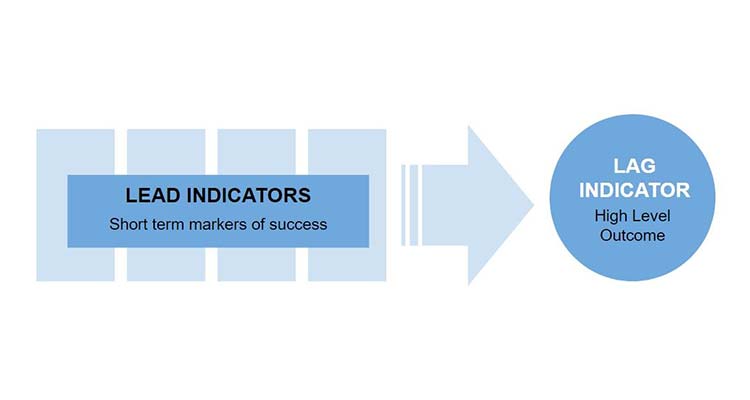
Starting with the end in mind, high level metrics are identified that indicate success such as graduation rates, or enrollment targets. Then smaller milestone metrics are established that would indicate that the college is making progress toward impacting the lag metric. These smaller milestones are lead indicators. Next, we'll explore an example below.
Lag Indicator: Enrollment Targets
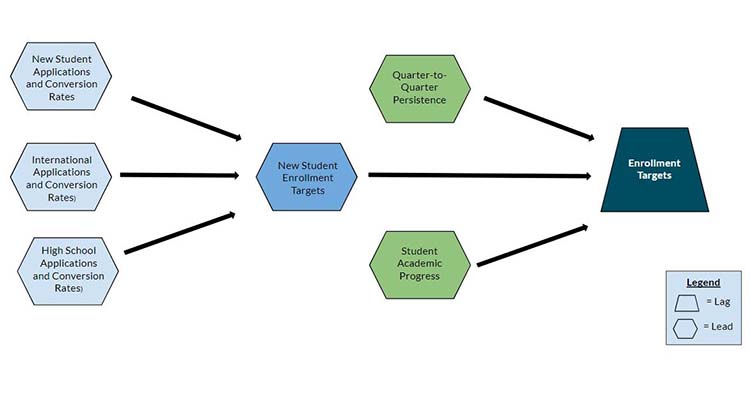
In this example, the identified lag metric is Enrollment Targets. The college aims to increase enrollment to fulfill our goals of increasing Access and Success. Many smaller metrics influence enrollments and are identified as lead metrics. There can be many lead metrics, and they all funnel toward the identified lag metric. In this model, if a lead metric shows poor performance, we can adjust our activities to impact the lead metric because we know that well performing lead metrics will lead to a well performing lag metric.